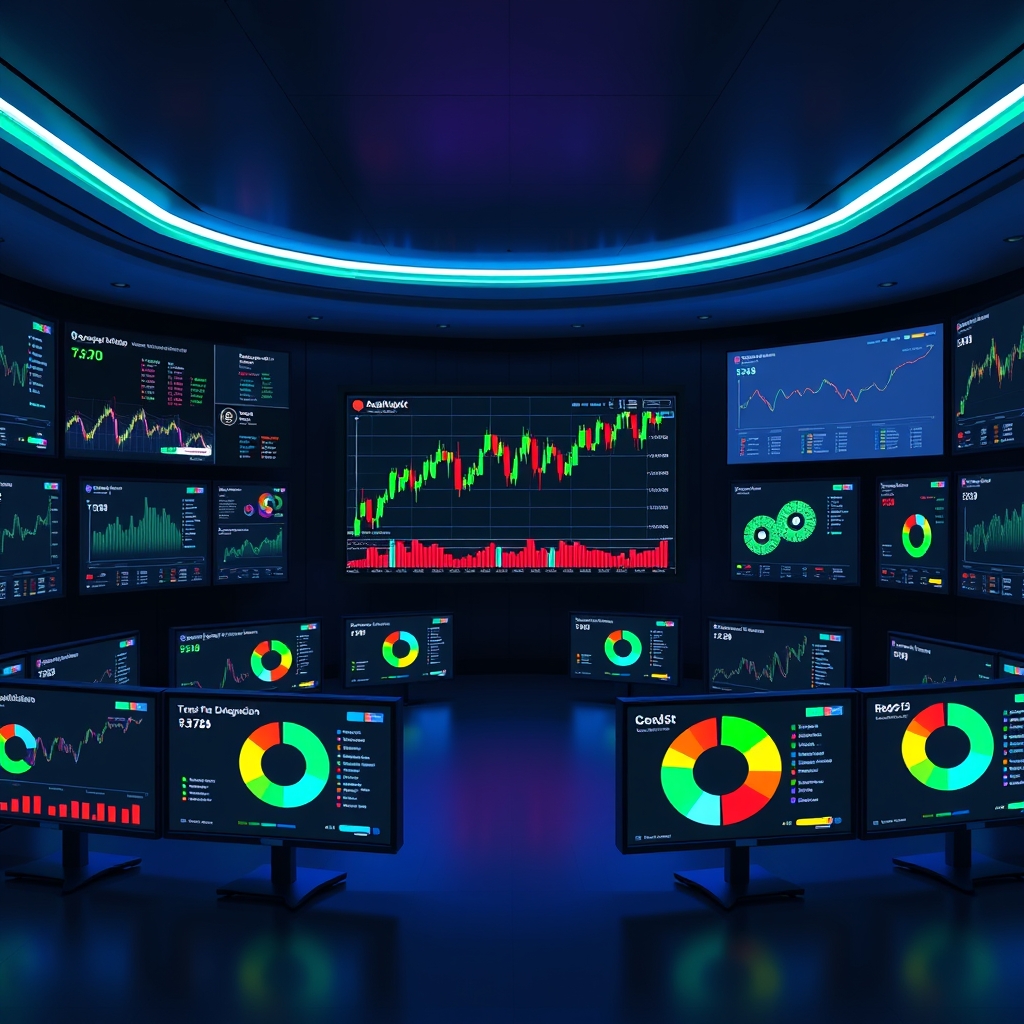
Analyzing Dow Jones U.S. Gold Mining Index Price Trends Over the Last 7 Days with Indices-API Time-Series Data
Analyzing Dow Jones U.S. Gold Mining Index Price Trends Over the Last 7 Days with Indices-API Time-Series Data
In the fast-paced world of financial markets, understanding price trends is crucial for making informed investment decisions. This blog post delves into analyzing the Dow Jones U.S. Gold Mining Index price trends over the last 7 days using the powerful capabilities of the Indices-API. By leveraging the time-series data provided by this API, developers can create sophisticated applications that analyze historical and real-time data, enabling them to derive actionable insights.
Understanding the Dow Jones U.S. Gold Mining Index
The Dow Jones U.S. Gold Mining Index is a benchmark that tracks the performance of companies involved in gold mining. This index is particularly relevant in times of economic uncertainty, as gold is often viewed as a safe-haven asset. Analyzing the price trends of this index can provide insights into market sentiment, investor behavior, and broader economic trends.
When analyzing the Dow Jones U.S. Gold Mining Index, it is essential to consider various factors that influence its price movements. These include:
- Global economic trends and market movements
- Technological advancements in financial markets
- Data-driven financial analysis and investment strategies
- Financial technology integration
- Financial market regulation and compliance
Leveraging Indices-API for Data Analysis
The Indices-API provides developers with access to a wide range of financial data, including real-time and historical rates for various indices. This API is designed to empower developers to build next-generation applications that can analyze market trends and provide insights based on real-time data. The API offers several endpoints that can be utilized for different analytical purposes.
Key Features of Indices-API
Indices-API offers a variety of endpoints that can be used to gather data for analysis:
Latest Rates Endpoint
The Latest Rates Endpoint provides real-time exchange rate data for various indices. Depending on your subscription plan, this endpoint can return data updated every 60 minutes, every 10 minutes, or even more frequently. This is particularly useful for tracking the Dow Jones U.S. Gold Mining Index as it allows you to monitor price changes in real-time.
{
"success": true,
"timestamp": 1780793424,
"base": "USD",
"date": "2026-06-07",
"rates": {
"DOW": 0.00029,
"NASDAQ": 0.00039,
"S&P 500": 0.00024,
"FTSE 100": 0.00058,
"DAX": 0.00448,
"CAC 40": 0.00137,
"NIKKEI 225": 0.0125
},
"unit": "per index"
}
Historical Rates Endpoint
The Historical Rates Endpoint allows you to access historical exchange rates for any date since 1999. This is invaluable for analyzing past performance and identifying trends over time. For example, you can query the API for the Dow Jones U.S. Gold Mining Index price on specific dates to understand how it has reacted to various market conditions.
{
"success": true,
"timestamp": 1780707024,
"base": "USD",
"date": "2026-06-06",
"rates": {
"DOW": 0.00028,
"NASDAQ": 0.00038,
"S&P 500": 0.00023,
"FTSE 100": 0.0124,
"DAX": 0.0126,
"CAC 40": 0.0126,
"NIKKEI 225": 0.0126
},
"unit": "per index"
}
Time-Series Endpoint
The Time-Series Endpoint is particularly useful for analyzing price trends over a specified period. By querying this endpoint, you can retrieve daily historical rates between two dates of your choice. For instance, if you want to analyze the Dow Jones U.S. Gold Mining Index over the last 7 days, you can set the start date to 7 days ago and the end date to today.
{
"success": true,
"timeseries": true,
"start_date": "2026-05-31",
"end_date": "2026-06-07",
"base": "USD",
"rates": {
"2026-05-31": {
"DOW": 0.00028,
"NASDAQ": 0.00038,
"S&P 500": 0.00023,
"FTSE 100": 0.0124,
"DAX": 0.0126,
"CAC 40": 0.0126,
"NIKKEI 225": 0.0126
},
"2026-06-02": {
"DOW": 0.00029,
"NASDAQ": 0.00039,
"S&P 500": 0.00024,
"FTSE 100": 0.0124,
"DAX": 0.0126,
"CAC 40": 0.0126,
"NIKKEI 225": 0.0126
},
"2026-06-07": {
"DOW": 0.00029,
"NASDAQ": 0.00039,
"S&P 500": 0.00024,
"FTSE 100": 0.0124,
"DAX": 0.0126,
"CAC 40": 0.0126,
"NIKKEI 225": 0.0126
}
},
"unit": "per index"
}
Convert Endpoint
The Convert Endpoint allows you to convert any amount from one index to another or to/from USD. This can be particularly useful when you need to analyze the value of investments in different currencies or indices. For example, if you want to see how much a certain amount of USD translates into the Dow Jones U.S. Gold Mining Index, you can use this endpoint.
{
"success": true,
"query": {
"from": "USD",
"to": "DOW",
"amount": 1000
},
"info": {
"timestamp": 1780793424,
"rate": 0.00029
},
"result": 0.29,
"unit": "per index"
}
Fluctuation Endpoint
The Fluctuation Endpoint tracks rate fluctuations between two dates. This is essential for understanding how the Dow Jones U.S. Gold Mining Index has changed over time. By analyzing the fluctuations, you can identify patterns and make predictions about future movements.
{
"success": true,
"fluctuation": true,
"start_date": "2026-05-31",
"end_date": "2026-06-07",
"base": "USD",
"rates": {
"DOW": {
"start_rate": 0.00028,
"end_rate": 0.00029,
"change": 1.0e-5,
"change_pct": 3.57
},
"NASDAQ": {
"start_rate": 0.00038,
"end_rate": 0.00039,
"change": 1.0e-5,
"change_pct": 2.63
},
"S&P 500": {
"start_rate": 0.0124,
"end_rate": 0.0125,
"change": 0.0001,
"change_pct": 0.81
}
},
"unit": "per index"
}
Open/High/Low/Close (OHLC) Price Endpoint
The OHLC Price Endpoint provides open, high, low, and close prices for a specific time period. This data is crucial for traders who rely on candlestick patterns and other technical analysis methods to make trading decisions.
{
"success": true,
"timestamp": 1780793424,
"base": "USD",
"date": "2026-06-07",
"rates": {
"DOW": {
"open": 0.00028,
"high": 0.00029,
"low": 0.00027,
"close": 0.00029
},
"NASDAQ": {
"open": 0.00038,
"high": 0.0004,
"low": 0.00037,
"close": 0.00039
}
},
"unit": "per index"
}
Interpreting the Results
When analyzing the data retrieved from the Indices-API, it is essential to understand the significance of each field in the API responses. For instance, when using the Time-Series Endpoint, the response includes daily rates for the specified period. Each date's rate can be compared to identify trends, such as upward or downward movements in the Dow Jones U.S. Gold Mining Index.
Additionally, the fluctuation data provides insights into the volatility of the index. A higher percentage change indicates greater volatility, which can be a signal for traders to adjust their strategies accordingly. Understanding the OHLC data can also help traders identify potential entry and exit points based on historical price movements.
Practical Use Cases
Developers can leverage the Indices-API to create various applications that analyze the Dow Jones U.S. Gold Mining Index. Here are some practical use cases:
- Investment Analysis Tools: Build applications that provide real-time analysis of the index, allowing investors to make informed decisions based on current market conditions.
- Automated Trading Systems: Create algorithms that utilize historical data to execute trades based on predefined criteria, such as price thresholds or fluctuations.
- Market Research Platforms: Develop platforms that aggregate data from multiple indices, providing users with comprehensive insights into market trends and performance.
Conclusion
Analyzing the Dow Jones U.S. Gold Mining Index price trends over the last 7 days using the Indices-API Time-Series data provides valuable insights for developers and investors alike. By understanding the various endpoints and their functionalities, developers can create sophisticated applications that harness the power of real-time financial data.
For more information on how to utilize the Indices-API, refer to the Indices-API Documentation and explore the Indices-API Supported Symbols for a complete list of available indices. With the right tools and knowledge, you can effectively analyze market trends and make data-driven investment decisions.